
Pay-What-It-Takes Philanthropy
This is a repost of an article first published in the Stanford Social Innovation Review.
By Jeri Eckhart-Queenan, Michael Etzel, & Sridhar Prasad Summer 2016
A new grantmaking approach is needed – one that provides enough money for nonprofits to pay for all their operations, not just programs and services. The first step toward achieving that is for grantmakers to realize that different types of nonprofits have different cost structures.
For years, nonprofits have campaigned for funders to end their widespread practice of providing full financial support for programs and services, but scrimping on overhead costs. This practice gives rise to the vexing “starvation cycle” that constrains nonprofits’ ability to invest in essential organizational infrastructure and creates tensions, and even dishonesty, between grantmakers and grantees.1
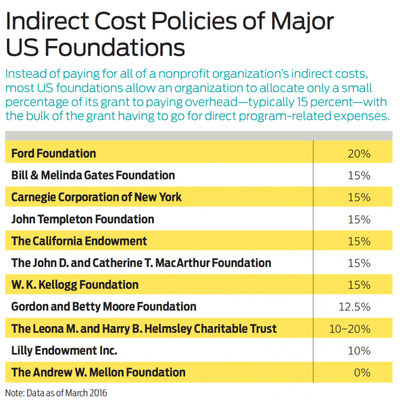
Recently, a handful of major funders and important intermediaries have joined nonprofits in declaring that it’s time to develop a new approach to grantmaking. The model they collectively support centers on an idea that we call “pay-what-it-takes” philanthropy—a flexible approach grounded in real costs that would replace the rigid 15 percent cap on overhead reimbursement followed by most major foundations.
Ford Foundation President Darren Walker is among the most outspoken funders calling for a new grantmaking approach. “All of us in the nonprofit ecosystem are party to a charade with terrible consequences—what we might call the ‘overhead fiction,’” says Walker. “The data included in this article along with comparable data for our grantees convinced us that we had to make a change.” Beginning January 1, 2016, Ford doubled its “overhead rate” (the percentage above direct project costs that can be used to pay indirect costs) to 20 percent. In doing so, it hoped “to encourage more honest dialogue about the actual operating costs of nonprofit organizations,” adds Walker.2
To begin that dialogue, it’s important to understand exactly how much nonprofits do spend on all aspects of their operations. The Bridgespan Group recently examined the financial records of 20 well-known, high-performing nonprofits to determine their actual indirect costs—those not attributed to a specific program or service.
We discovered that indirect costs make up a much larger percentage of a nonprofit’s total costs than is widely understood. Of the nonprofits we surveyed, indirect costs made up between 21 percent and 89 percent of total costs. The median indirect cost rate for all 20 nonprofits was 40 percent, nearly three times the 15 percent overhead rate that most foundations provide. To be clear: Higher or lower is neither better nor worse. These figures are not measures of either effectiveness or efficiency. Rather, they reflect the mix of direct and indirect costs required to deliver impact.
That current reimbursement policy falls far short of covering nonprofits’ real costs came as no surprise. The real insight came from seeing that different types of nonprofit organizations have clearly different cost structures. Nonprofit research labs, for example, have a median indirect cost rate of 63 percent, two and a half times the 25 percent median rate of direct service organizations in our survey.
This variance in indirect cost rates mirrors the industry segmentation long recognized in the for-profit sector. Among firms in the S&P 500, for example, consumer staple companies have a median indirect cost rate of 34 percent, whereas information technology companies reach 78 percent.3 Unfortunately, an equivalent taxonomy of industry segments does not yet exist in the nonprofit sector.
Even without a taxonomy, it’s clear that philanthropy’s prevailing 15 percent indirect cost reimbursement policy does not take into account the wide variation in costs from segment to segment. Doing so would have far-reaching effects on philanthropy and grantees. If nonprofits committed to understanding their true cost of operations and funders shifted to paying grantees what it takes to get the job done, the starvation cycle would end.
Assessing Indirect Costs
Before beginning our research into nonprofit cost structures, we had to be clear about what exactly we were looking for. We quickly set aside the term “overhead” because it lacks a standard definition. We opted instead to use “indirect costs.” That term typically includes all costs that are not directly attributable to a specific project. “Indirect cost” is more inclusive than “overhead,” which is typically understood as only administrative costs. And it has an analog in the business world, where the term “SG&A” (selling, general, and administrative expenses) covers all non-production costs, such as executive salaries, staff training, office space, equipment, research, travel, and technology—all reasonable and necessary costs of doing business. Likewise, in the nonprofit world, indirect costs are necessary and inextricably tied to a nonprofit’s ability to accomplish its goals.
Substituting the term “indirect costs” for “overhead” still is a losing semantic battle, contends Roger Martin, former dean of the Rotman School of Management at the University of Toronto. “The language is a problem,” he says. “Who would want to support overhead or indirect costs?” He favors adopting more descriptive terms like those used in the for-profit world, such as research and development, administration, or distribution—“things that sound useful.” We agree that language is a problem—we just don’t have a better solution yet.
With indirect costs as our guide, we examined the financial records of a sample of nonprofits that included domestic and global organizations with annual budgets ranging from $2 million to $650 million. Regardless of their missions, which varied greatly, indirect costs fell into four general categories: administrative expenses, network and field, physical assets, and knowledge management. Because nonprofits can have very different funding models, we decided not to include fundraising costs as indirect costs.
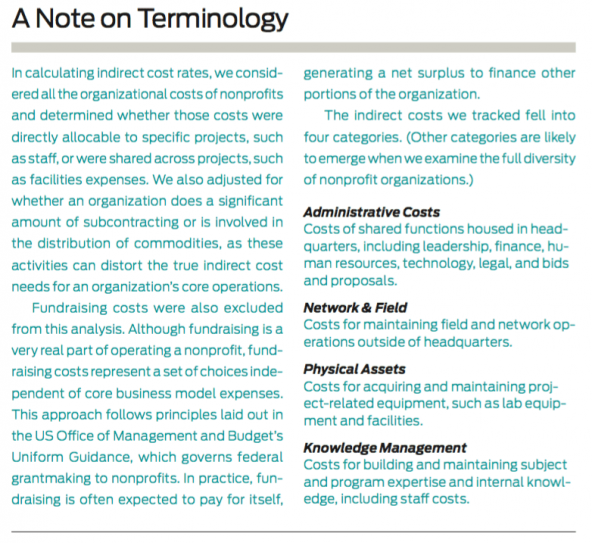
The nonprofits in our sample can themselves be grouped into four segments: US-based direct service organizations, policy and advocacy organizations, international networks, and research organizations. (See “Participating Organizations” on page 39 for the names of most of the nonprofits that were surveyed.) There are, of course, other types of nonprofits that have different cost structures, but these four segments represent a diverse and broad group.
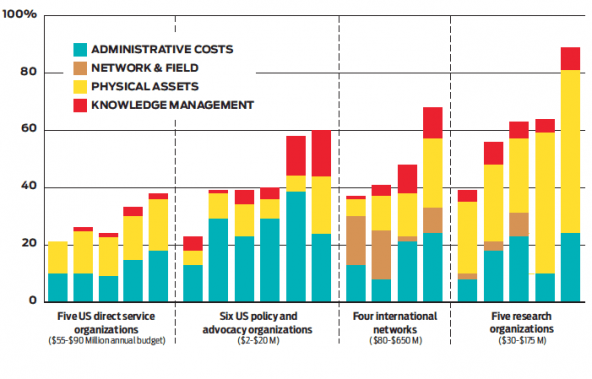
What becomes clear is that different segments of the nonprofit sector have different indirect cost structures. In addition, expenditures of otherwise similar organizations in the same segment vary because of different strategic choices. (See “Actual Indirect Costs as a Percentage of Direct Costs” below.) To better understand how costs vary by segment, let’s compare two nonprofits. One is an innovative biomedical sciences laboratory that employs researchers tasked with finding cures for lethal diseases. For this organization, direct costs are researchers’ time and materials to conduct complex experiments. In addition, this institution must make a significant indirect investment to conduct its work—it must pay for large facilities and sophisticated equipment capable of performing to the strictest biosafety standards. Required physical assets claimed 57 percent of this organization’s spending, more than double the amount (24 percent) spent on administration. Another 8 percent went to knowledge management, bringing total indirect costs to 89 percent.
The cost structure was very different for a large international NGO where network management is the salient capability. It takes a wellmanaged organization at global, regional, and local levels to translate funding from an international development agency into, for example, well-nourished children in India’s Bihar state. This organization’s largest indirect expenditure category, network and field at 17 percent, sustained the field office operations infrastructure. Physical assets for all those offices absorbed 12 percent of indirect costs, followed by 8 percent for administrative costs and 4 percent for knowledge management. Total indirect costs for this NGO came to 41 percent.
The cost and segmentation data derived from our research lead to two insights. First, flatrate reimbursement for indirect costs is conceptually wrong because it doesn’t take into account the differences by segment. Second, the magnitude of actual indirect cost rates of the nonprofits we studied demonstrates that 15 percent—the typical reimbursement rate—is too low. It doesn’t represent the actual indirect costs it takes to run any of the nonprofits we analyzed.
Actual Indirect Costs as a Percentage of Direct Costs
Bridgespan examined the cost structures of 20 nonprofit organizations across four different segments. At those organizations, indirect costs ranged from 21 percent to 89 percent of direct costs.
Creating a New Conversation
Armed with data about the actual indirect costs incurred by a wide variety of nonprofits, we can begin to build a framework for a new approach to philanthropic grantmaking. Starting with an organization’s segment, and then identifying the associated component costs of achieving desired impact, reframes the grantmaking conversation. It shifts from an emphasis on what it takes to fund a program to what it takes to achieve impact. This is the essence of the pay-what-it-takes approach to grantmaking.
Today, this kind of meaningful conversation doesn’t happen often. The CEO of a girls’ mentoring program painted a stark picture of her reality: “It’s very difficult to have honest conversations [about finances] with our city, county, and philanthropic funders,” she says. “They don’t want to listen. So we have to have two budgets: one that has the real numbers, and another that shows the funders what they want to see. If you don’t give them what they want, they won’t give you any money.”
Funders need to take the first step. Don Howard, president of the Irvine Foundation, already has initiated a deeper conversation. “At a minimum, we have committed ourselves to have a conversation with every grantee about what their indirect costs really are,” says Howard. But nonprofits also need to be prepared to discuss what it costs them to create real value, not just to fund programs. “Nonprofit leaders will benefit greatly from having a new shared language and way of thinking about this issue,” says David Dodson, president of MDC, a Durham, N.C.-based nonprofit that publishes the State of the South reports and is dedicated to improving economic opportunity and mobility in the region.
The Consequences of Underfunding
The advantage of a pay-what-it-takes policy is that it eliminates the need for the shadow economy in which funders and grantees purposely obscure financial data and quietly craft end runs around the arbitrary indirect cost spending caps imposed by most foundations. Foundation program officers, for example, often team up with grantees to recategorize underfunded indirect costs as direct costs that the funder covers. Other times, funders approve capacity-building or general operating grants to close the indirect cost gap. As a result, we do not know as a sector what it really costs to achieve impact.
“We know that for a grantee, 15 percent is not enough, so we give general operating support and capacity-building grants to compensate the grantee,” explains one program director. “One of our grantees is a very important partner,” says a foundation deputy director, “but we had to do a number of work-arounds, including creating a separate institute that the foundation could fund directly.”
A Bridgespan analysis of 10 grantees of one major foundation found that seven received additional financial support via work-arounds—the shadow economy in action. Work-arounds, particularly if under the table, create their own problems. They are inconsistently applied, and the time-consuming negotiations they entail increase complexity and raise transaction costs while distracting nonprofits and foundations from programmatic work. The pain inflicted by all these financing schemes, in both hard feelings and valuable time lost, is a major source of irritation for grantees and funders alike.

“I had two hours in my calendar yesterday booked for science, but I ended up spending that time on indirect cost negotiations,” says the CEO of a research nonprofit, who is also one of the world’s leading scientists in his field. “Is that really the highest and best use of my time?” A sympathetic foundation director agrees: “There’s an opportunity cost incurred by focusing on these issues versus the programmatic side of the grant, and this has an overall cumulative effect on impact.”
Work-arounds also create an environment that drives some nonprofits away and even discourages some organizations from applying for grants in the first place. “The best organizations don’t want to work for us, and the ones who want to work for us are not the best,” laments a foundation director about the impact of the organization’s 15 percent cap on indirect costs. A leader at one of the world’s largest global NGOs told us that the organization will no longer work with a foundation that fails to cover indirect costs.
Ultimately, if work-arounds don’t sufficiently cover indirect costs, organizations scramble to make up the difference. And they often end up short of funds. Some nonprofit CEOs, for example, report spending up to 40 percent of their time dealing with indirect cost reimbursement issues, between negotiations and fundraising to cover the gaps. Others resort to tapping unrestricted funds, forgoing institutional investments that improve effectiveness and efficiency.
“We had to spend $12 to $18 million of our own unrestricted dollars to fund forgone indirect costs in 2014,” says Carolyn Miles, president and CEO of Save the Children USA. “If we did not have to spend that money on indirect costs, we would redeploy these funds to initiatives such as helping push promising practices through the R&D pipeline.”
Federal Rules for Indirect Costs
The US federal government uses what it calls a negotiated indirect cost rate agreement (NICRA) to guide how it allocates billions of dollars in indirect costs to domestic nonprofits, international NGOs, and universities. The government’s goal is to pay its fair share of grantees’ costs of doing business. To the extent that indirect costs are reasonable, allocable, and allowable as defined by federal rules, the government considers them a legitimate cost of doing business payable under a government contract. A nonprofit works with the federal agency that supplies the majority of its funding to develop its negotiated indirect cost rate. The resulting NICRA is binding on every government agency that funds the organization.
Large domestic nonprofits that receive significant funding from federal agencies tend to have a NICRA. Smaller nonprofits, especially those that receive federal grants administered by a state or local government, typically don’t have a negotiated rate. In the past, many nonprofits without a negotiated rate never received any federal reimbursement for indirect costs. But federal contracting rules that took effect December 26, 2014, for the first time ensure that all nonprofits receiving federal grant money—either directly or passed through state or local governments—receive at least 10 percent reimbursement for their indirect costs. Nonprofits that already have a NICRA will continue to receive that amount. The new mandate is embedded in grantmaking rules called the Uniform Guidance issued by the US Office of Management and Budget.
Universities operate under somewhat different rules. The indirect costs associated with a federal grant are incurred by the institution, not the professor who receives the grant. It’s the institution that maintains the buildings and equipment and provides operational support (utilities, janitorial services, and the like). With federal grants, universities rely on NICRAs, typically resulting in rates upward of 45 percent for on-campus grants and around 25 percent for off-campus work.
The rules vary across the landscape of federal grantmaking, but the goal remains the same: acknowledge and fairly reimburse indirect costs. For foundations, this general principle is more useful than the actual negotiated rates their grantees may have with the federal government. The rates reflect idiosyncratic ways grantees define indirect costs that may not align with how a foundation defines those costs. Nonetheless, the federal government’s negotiated rates are useful guideposts for foundations to factor into their own indirect cost decision-making.
Tough Questions for the Sector
Moving to a pay-what-it-takes approach to grantmaking won’t be easy. But some funders are rethinking their approach. For them, paying what it really takes to run a nonprofit would send a powerful message to grantees: We want to solve society’s biggest problems and recognize that we must build strong, effective organizations to do so—not just contract for projects and services.
For nonprofits, pay-what-it-takes means doing their homework to be clear about their operational needs and how those needs relate to desired impact. Some funders are already working with grantees to accomplish this goal. At the William and Flora Hewlett Foundation, Daniel Stid, director of the Madison Initiative on good governance, has modified the initiative’s grant application form to provide grantees with links to resources to calculate their indirect costs when applying for project grants. “In our experience, the typical issue in grantee submissions is not that the overhead cost estimates are too high, but rather that they are too low,” says Stid. The president and CEO of the Weingart Foundation, Fred Ali, believes that more funders should help their grantees in a similar fashion. “We have the opportunity to provide grantees with better tools to understand their costs,” he says.
Some funders are joining forces to influence a change in funder policies about indirect costs. The newly formed Real Cost Project—comprising Northern California Grantmakers, San Diego Grantmakers, andSouthern California Grantmakers—is exploring what it takes for funders to develop grantmaking practices based on what it really costs to deliver desired outcomes. A logical place for foundations and nonprofits to start is to work on collecting, reporting, and analyzing accurate information on actual indirect expenditures. Good data are essential for everyone involved to learn and improve, but they are hard to come by.
IRS Form 990, filed annually by most US nonprofits, is the best current source of information about a US nonprofit’s expenditures. Unfortunately, 990s don’t shed much light on actual indirect costs. The form has categories for “program” expenses and “management and general” expenses, but it gives nonprofits little guidance on defining the terms. That vagueness leads to widespread reporting inconsistencies as organizations apply their own definitions. As part of our research, we compared Form 990 management and general expenses to the indirect costs we identified in our analysis of nonprofit expenditures. Among the eight nonprofits we sampled, the 990 data frequently did not match our assessment of indirect costs. As one nonprofit executive says: “If you think you can analyze a nonprofit through IRS filings, you are in outer space.”
Accurate, comparable data on indirect costs would, for the first time, make it possible to create a set of benchmarks that foundations and nonprofits could use to gauge costs for organizations of comparable size and focus. The indirect costs for food pantries, for example, would look different from the cost structures of nonprofits with regional networks, like the YMCA. And arts organizations would differ from those serving the homeless.
Benchmarks could also lay the groundwork for identifying best practices and setting target indirect cost expenditure levels for most nonprofits. And they could create a basis for a shared understanding between nonprofits and foundations of a new approach to grantmaking that accounts for nonprofits’ real costs. Broad benchmarking across the sector lay beyond the scope of our project, but the segments and cost components we identified can be the basis for a joint effort by funders and nonprofits to develop benchmarks to advance sector-wide understanding of indirect costs.
An alternative to benchmarks for indirect costs is a custom, external audit, like those required by the federal government’s funding process. This approach would be cost-effective for foundations’ large grantees, and what we learn from custom audits may inform further segmentation and benchmarking.
Skeptics of benchmarking, however, maintain that it’s an attempt to rescue a flawed and outmoded funding model. As alternatives, some favor grantmaking based on paying total real costs per outcome, and others advocate a shift to greater general operating support. Although both approaches have their place, we believe benchmarking holds more promise for the majority of nonprofits.
A cost-per-outcome policy works for organizations that deliver readily identifiable services, such as vaccinations or daily meals. Many nonprofits that deliver such services are strengthening their impact measurement capabilities to more clearly demonstrate a social return on investment for their projects. This is a welcome trend, enabling the sector to increasingly focus on the underlying value of each dollar invested, instead of simply pure cost. But our work with some of the world’s largest foundations leads us to conclude that this method is not feasible for the majority of their grantmaking. It’s not practical for a significant percentage of nonprofits that would have difficulty measuring outcomes in the near term, say for early childhood programs designed to promote high school graduation. In addition, an outcomes approach broadly applied could stifle investments in early-stage programs and undermine the persistence it takes for social movements to try and fail on the road to eventual success, such as the marriage equality movement. We see a cost-peroutcome approach as complementary, but ultimately not a panacea to the problems with the current funding system.
Providing general operating support offers the flexible, adaptable funding that nonprofits desire. But greater general operating support does not necessarily lead to stronger, better organizations. Nonprofits first need a clearer understanding of their mission-critical capabilities—and what best-in-class execution costs—to allocate general operating funds to the highest-impact use.
For all of its potential benefits, benchmarking may take a toll on some nonprofits. It will inevitably create winners and losers. As the Ford Foundation’s Walker says, “Almost certainly, providing deeper, more intensive support will result in fewer grants, and, most likely, fewer grant recipients.” This is not news for some funders that have a deep relationship with a small number of grantees, such as the Edna McConnell Clark Foundation and New Profit. But it represents a major shift in thinking for the philanthropic sector as a whole.
Of course, just making bigger grants to cover indirect costs does not guarantee the intended results. Our extensive literature review on organizational effectiveness confirmed that the social sector has accumulated anecdotal experience linking fuller funding of indirect costs to greater impact, but not much evidence. So early adopters that engage in benchmarking should work together to measure and learn in a way that will advance the state of evidence about what works for the field.
These open questions underscore the need for foundations and nonprofits to set their sights on a research agenda that tests the practical application of segmentation and benchmarking of indirect costs. Such an undertaking would harness the growing momentum for change in the grantmaking status quo while pursuing a path of proven value in the private sector. A lot of hard work lies ahead for paying-what-it-takes to become the solution to breaking the nonprofit starvation cycle, but this work is crucial to building sustainable, longlasting nonprofits that are real agents of change.
This article has been modified since its initial publication. The description of the chart labeled “Actual Indirect Costs as a Percentage of Direct Costs” has been corrected to say that organizations’ indirect costs ranged from 21 percent and 89 percent of direct costs. It had previously said indirect costs made up 21 to 89 percent of total costs.